Create Stunning Graphs with AI Graph Maker
Graphs Generated by AI Graph Maker
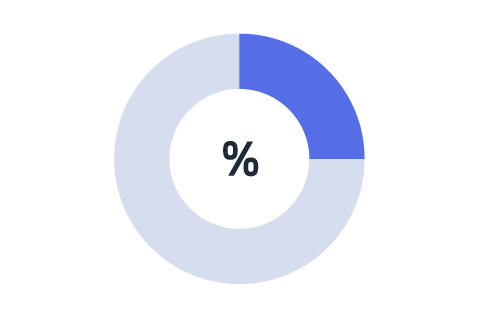
Pie Chart
A pie chart is a circular statistical graph that displays the proportion of each part in relation to the whole, highlighting the importance of specific segments. This type of graph is commonly used in market analysis, financial reports, demographic studies, resource allocation, project progress tracking, and more. With AI Graph Maker, creating pie charts is now faster and easier than ever.
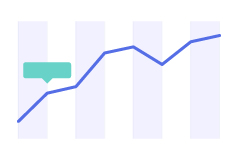
Line Chart
With AI Graph Maker, you can easily create Line Charts to visualize trends in data over time or across ordered categories. These AI-powered graph tools are widely used in various fields such as time series analysis, financial management, business operations, scientific research, and marketing. AI Graph Maker allows users to quickly understand data fluctuations and trends through clear, simple visualizations, enabling more informed and effective decision-making. Thanks to its intelligent chart generation capabilities, AI Graph Maker helps users efficiently create accurate line charts, streamlining data analysis and enhancing decision-making processes.
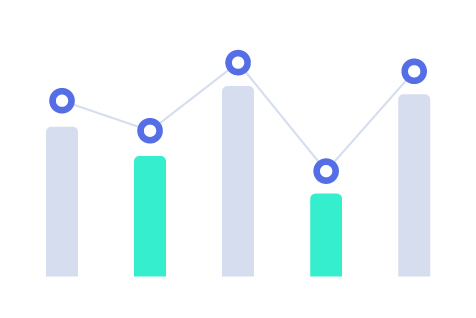
Bar chart
With the AI Graph Maker, bar charts are generated by visualizing data using the length or height of rectangular bars, making it easy to compare data across different categories or time periods. This tool is especially ideal for displaying discrete data, categorical data, and time-series data, enabling clear comparisons between different datasets. Powered by AI, AI Graph Maker quickly produces professional, accurate bar charts, providing powerful support for data visualization.

Flowchart
A flowchart uses graphical symbols to represent the steps of a process or task, making complex workflows easier to understand. With AI Graph Maker, you can quickly create clear and effective flowcharts for various applications, including project management, software development, training, and business process mapping.

Timeline
With the AI Graph Maker, generate timelines that display events or tasks in chronological order, providing users with a clear view of their schedule. Whether it's for project management, personal planning, historical tracking, or event planning, the AI Graph Maker's timeline feature offers a powerful and intuitive tool for time management. It helps users efficiently plan and control task progress, ensuring that everything is completed on time and improving overall productivity.
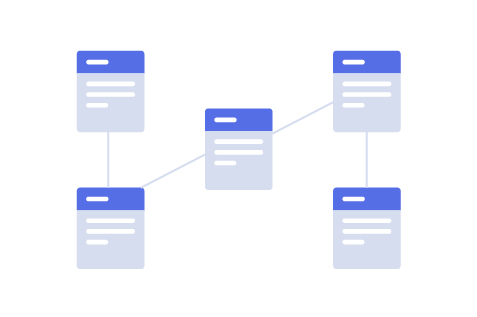
ER Diagram
The AI Graph Maker generates Entity-Relationship Diagrams (ER diagrams), a graphical tool used to describe data models and showcase relationships between entity sets. AI Graph Maker's ER diagrams are widely used in database design, system analysis, object-oriented design, enterprise system modeling, and many other fields. With the help of the AI-powered graph tool, developers can quickly generate high-quality ER diagrams, significantly reducing the time spent on manual diagramming.
Mindmap
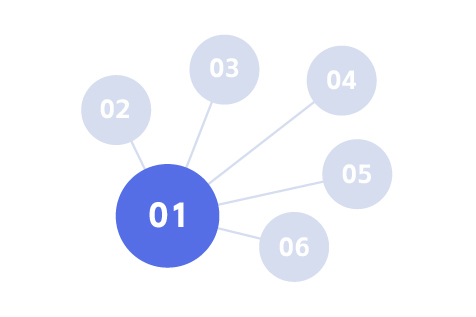
The AI Graph Maker generates Mind Maps, which visualize the relationships between a central theme and related subtopics. The Mind Maps are commonly used for personal and team activities such as brainstorming, planning, learning, decision-making, and creative work. AI Graph Maker helps users clearly understand complex concepts, efficiently organize and present information, and enhance both thinking efficiency and decision-making quality. With the intelligent chart generation capabilities of AI Graph Maker, users can quickly create structured mind maps that streamline information organization and decision-making processes, boosting productivity.
Gantt Chart
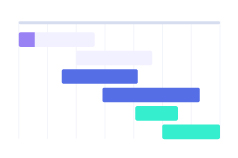
The AI Graph Maker generates Gantt Charts, a powerful tool that visually displays task progress using bar graphs. It is widely used in fields such as project management, team collaboration, time management, and event planning. Powered by AI technology, the AI Graph Maker automatically creates professional Gantt charts, helping users efficiently plan tasks, track progress, and optimize resource allocation to improve productivity and ensure projects are completed on time.
Features of AI Graph Maker

Responsive Design

AI-Generated

Visual Adjustment

Multi-format Export

User-friendly Interface

Chart Diversity
How to Create a Graph with Our AI Graph Maker
01
Enter Your Data
02
Choose Your Graph Type
03
Generate Your Graph
04
Edit the Graph
05
Download and Share

AI-Powered Graph Generation
AI Graph Maker autonomously queries, analyzes, and summarizes data to generate the most suitable chart types. This feature streamlines the data visualization process, ensuring that users receive accurate and insightful representations tailored to their specific needs.
Flexible Editing and Export Options
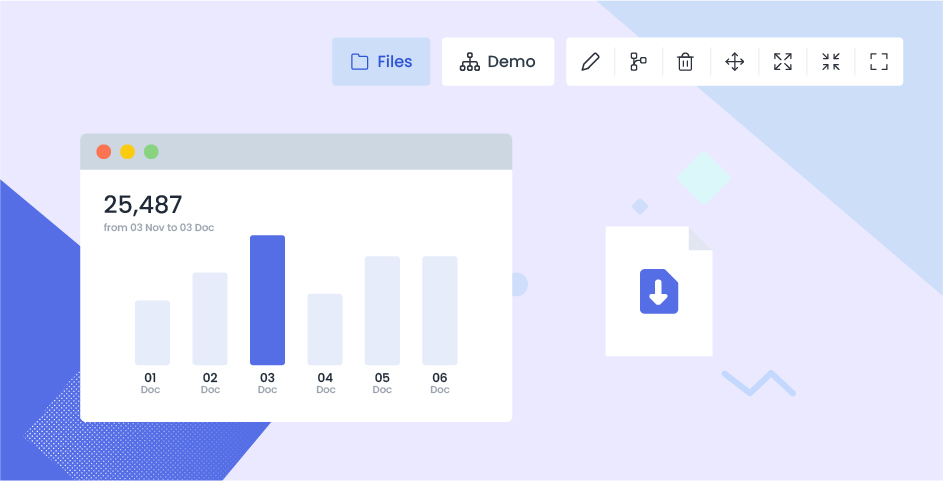
Users can easily customize the colors and make edits to the generated graphs. AI Graph Maker also allows exporting graphs in multiple formats, such as PNG, SVG, and Mermaid, ensuring compatibility with different use cases.

Cross-Platform Use and Sharing
AI Graph Maker's robust support for multiple export formats allows users to efficiently utilize and share their graphs across diverse platforms and scenarios. This capability significantly enhances the utility and flexibility of the graphs, making them an indispensable tool for professionals.

Perfect for Professionals & Beginners
Whether you're a data analyst or just starting with graphs, our AI Graph Maker is designed for ease of use. It’s powerful enough for experts, but simple enough for anyone to use.
FAQs for AI Graph Maker
01
How to Create Graphs Using the AI Graph Maker Tool?
Creating graphs with our AI Graph Maker tool is simple and quick. Follow these steps to generate your desired graph in just a few minutes:
- Go to the Graph Creation Page: Navigate to the graph maker section on our platform to start creating your graph.
- Choose the Graph Type You Want to Create: Select the type of graph you want to generate. Our AI graph maker supports various graph types, including pie charts, line graphs, bar charts, timelines, flowcharts, and more. Choose the most appropriate graph based on your data visualization needs.
- Input Your Data: Enter your data manually, or upload a data file (txt, Excel, etc.). Our AI will automatically analyze your data and create a graph that best fits the information you provided.
- Customize Your Graph’s Content and Style: Once the AI generates your graph, you can adjust the content, style, and colors as needed. Our graph maker allows you to fine-tune various elements, including labels, font styles, chart colors, and more, to perfectly match your preferences.
- Export and Use Your Graph: After customization, you can easily export the final graph in various formats (e.g., PNG, PDF, SVG) for use in reports, presentations, or websites.
By following these easy steps, you can effortlessly create professional-quality graphs with our AI Graph Maker tool, saving time while presenting your data effectively.
02
Can I Customize the Style and Content of the Generated Graphs?
Yes, you can fully customize the graphs generated by our AI Graph Maker. After the graph is created, you have the flexibility to adjust the following:
- Data Content: Edit or update the data manually to reflect changes.
- Graph Style: Customize the colors, fonts, labels, titles, and other visual elements of the graph.
Once you've made your adjustments, the graph will update in real time, ensuring it meets your specific needs.
03
Can I Export the Generated Graphs?
Yes, you can easily export the graphs generated by our AI Graph Maker in a variety of formats. Supported export options include:
- Image Formats: PNG
- Vector Formats: SVG
- Data Files: Mermaid (for further use in other tools)
To export your graph, simply click on the graph editing area and select the "Download" button on the right-hand menu. Choose your preferred format and save the file to your device.
04
How to Customize the Colors, Fonts, and Styles in Your AI-Generated Graph
Once your graph is generated, you can easily customize its appearance using the style editing features in the tool. You can:
- Choose from preset themes or customize colors to match your preferences.
- Adjust the fonts for titles, labels, and axes.
- Change the color and style of data points, bars, or lines.
With these customization options, you can make your graph visually appealing and aligned with your unique design needs using the AI graph maker.
05
How to Contact Technical Support or Get Help with Your AI Graph Maker
If you encounter any issues while using our service, you can easily reach out to our technical support team by emailing us at [email protected]. Our team will respond as quickly as possible to assist you with any problems related to AI tools, graph creation, or any other features of the platform.
For more detailed help with creating graphs, AI-powered solutions, or any troubleshooting related to the graph maker tools, don’t hesitate to contact us. We're here to ensure a smooth experience with our advanced AI-driven technologies.
